Simple timing chart with events in Flex
I am looking for a simple timeline chart so that I can display multiple events at different times. I haven't found any specific graphs in Flex, has anyone created or used anything along these lines? I found this, Created a timeline from date to date in Flex / AS3 , but this is only partially what I'm looking for.
+2
source to share
1 answer
I created a timeline using mx: PlotChart. It looks like this:
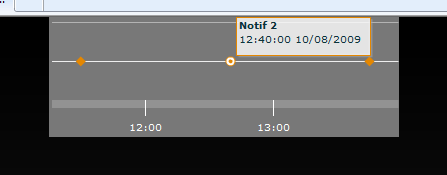
I used PlotChart with DateTimeAxis along the bottom and LinearAxis along the side. I put this in a small little Flex app:
<mx:Script>
<![CDATA[
import mx.charts.chartClasses.IAxis;
import mx.charts.HitData;
import mx.collections.ArrayCollection;
[Bindable]
public var max:Date;
[Bindable]
public var min:Date;
[Bindable]
private var notifAC:ArrayCollection;
public function init():void
{
var notif1:Date = new Date(2009, 9, 8, 11, 30, 0, 0);
var notif2:Date = new Date(2009, 9, 8, 12, 40, 0, 0);
var notif3:Date = new Date(2009, 9, 8, 13, 45, 0, 0);
notifAC = new ArrayCollection( [
{ Date: notif1, Name: "Notif 1", Value: 1 },
{ Date: notif2, Name: "Notif 2", Value: 1 },
{ Date: notif3, Name: "Notif 3", Value: 1 } ]);
//set min and max to outside most notifs
min = new Date(notif1.getTime());
max = new Date(notif3.getTime());
//calculate the range between min and max
var timelineRange:Number = max.getTime() - min.getTime();
//if less than 2 hours switch to minutes
if(timelineRange < 7200000)
{
timelineDateAxis.dataUnits = "minutes";
}
//if greater than 2 days switch to days
else if(timelineRange > 172800000)
{
timelineDateAxis.dataUnits = "days";
}
//as long as the timeline has a range other than 0, add 10% to the min and max
if(timelineRange != 0)
{
min = new Date(min.getTime() - (timelineRange * .1));
max = new Date(max.getTime() + (timelineRange * .1));
}
//if the timeline does have a range of 0, add 1 minute to min and max
else
{
min = new Date(min.getTime() - 60000);
max = new Date(max.getTime() + 60000);
}
//set the min and max of the axis
timelineDateAxis.minimum = min;
timelineDateAxis.maximum = max;
}
public function timelineDataTips(e:HitData):String
{
return "<b>" + e.item.Name + "</b>\n" + dataTipsFormatter.format(e.item.Date);
}
]]>
</mx:Script>
<mx:Style>
.issueTimelineHolder
{
background-color:#787878;
}
.issueTimelineChart
{
padding-top:5px;
padding-right:0;
padding-bottom:0;
padding-left:0;
}
.timelineDateAxis
{
color:#ffffff;
}
</mx:Style>
<mx:Stroke id="timelineDateAxisStroke"
color="#9B9B9B"
weight="8"
alpha=".75"
caps="none"
/>
<mx:Stroke id="timelineTickStroke"
color="#ffffff"
/>
<mx:DateFormatter id="dataTipsFormatter" formatString="HH:NN:SS MM/DD/YYYY" />
<mx:Canvas styleName="issueTimelineHolder" width="350" height="120">
<mx:PlotChart id="issueTimelineChart" styleName="issueTimelineChart" width="100%" height="100%"
showDataTips="true" dataTipFunction="timelineDataTips" dataProvider="{notifAC}">
<mx:backgroundElements>
<mx:GridLines direction="horizontal" />
</mx:backgroundElements>
<mx:verticalAxis>
<mx:LinearAxis id="timelineValueAxis" minimum="0" maximum="2" interval="1" />
</mx:verticalAxis>
<mx:verticalAxisRenderers>
<mx:AxisRenderer axis="{timelineValueAxis}" showLabels="false" showLine="false"
tickPlacement="none" minorTickPlacement="none" />
</mx:verticalAxisRenderers>
<mx:horizontalAxis>
<mx:DateTimeAxis id="timelineDateAxis" dataUnits="hours"
minimum="{min}" maximum="{max}" displayLocalTime="true"/>
</mx:horizontalAxis>
<mx:horizontalAxisRenderers>
<mx:AxisRenderer axis="{timelineDateAxis}" styleName="timelineDateAxis" tickPlacement="outside">
<mx:axisStroke>{timelineDateAxisStroke}</mx:axisStroke>
<mx:tickStroke>{timelineTickStroke}</mx:tickStroke>
</mx:AxisRenderer>
</mx:horizontalAxisRenderers>
<mx:series>
<mx:PlotSeries xField="Date" yField="Value" />
</mx:series>
</mx:PlotChart>
</mx:Canvas>
+3
source to share